The Historic Map Layers
Posted by Duncan Hay on Sept. 20, 2016
One of the quirks of copyright is that even if an old map is well out of its copyright term, reproductions of that map automatically become the copyright of whoever made the copy. So that whilst it’s possible for academics to download and view old maps from the University of Edinburgh’s Digimap collections (https://digimap.edina.ac.uk/) for research purposes, it’s not possible to put them online for others to view. We have two historic map layers available on Histories of Whitechapel: the Rocque map of 1746 and the 1873 Ordnance Survey, donated by the Institute of Historical Research (http://www.history.ac.uk/) and Tower Hamlets Local History Library and Archives (https://www.ideastore.co.uk/local-history) respectively.
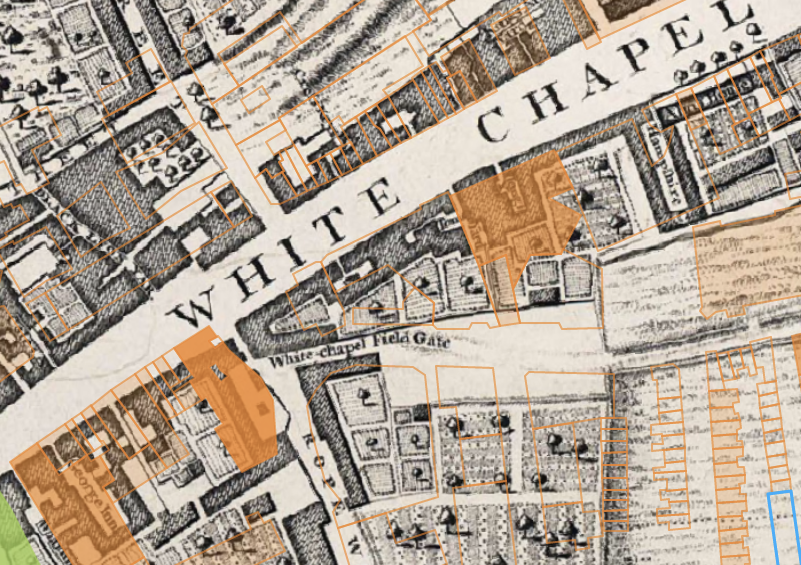
The Rocque Map scan was produced for the Locating London’s Past project (https://www.locatinglondon.org/), and the process by which it was created was quite involved due to the age of the map sheets and the way they were made. You can read about the process on their blog https://locatinglondonspast.wordpress.com/2011/06/22/recreating-rocque-london-1746/. We’ve published just a small excerpt on the Histories of Whitechapel map. There are some lovely details: taking a look at the area around East London Mosque, it seems quite likely that Fieldgate Street is so called because it was the street that led to the fields:
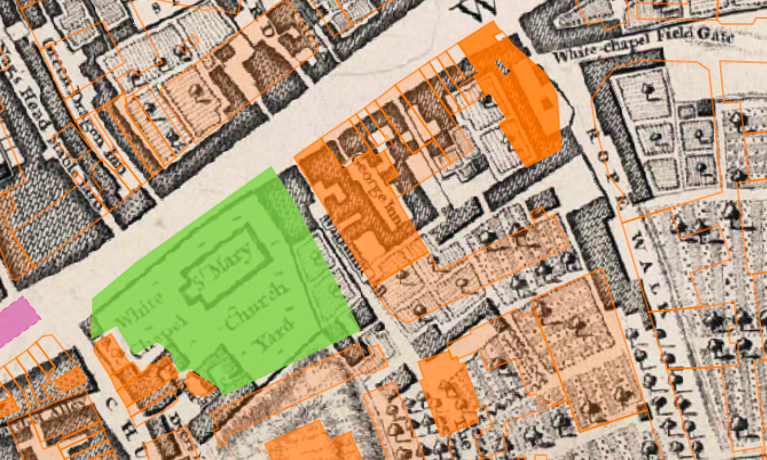
14 Whitechapel Road, Currently Haji Nanna Biryani, which the Survey have identified as formerly being the George public house, constructed c.1881, is on the site of an even older building, the George Inn. This suggests that food and drink have been served on this site for at least 270 years:
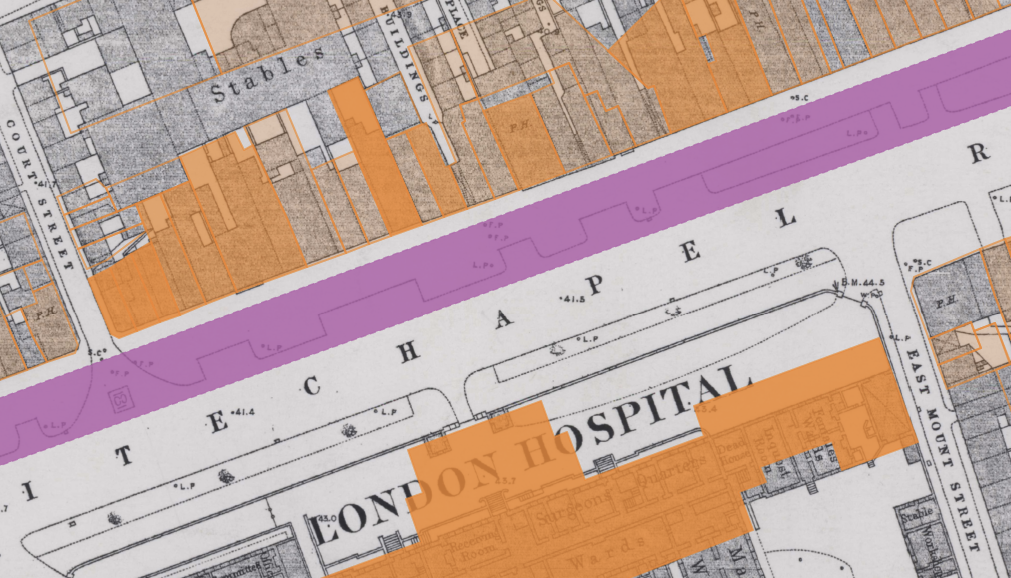
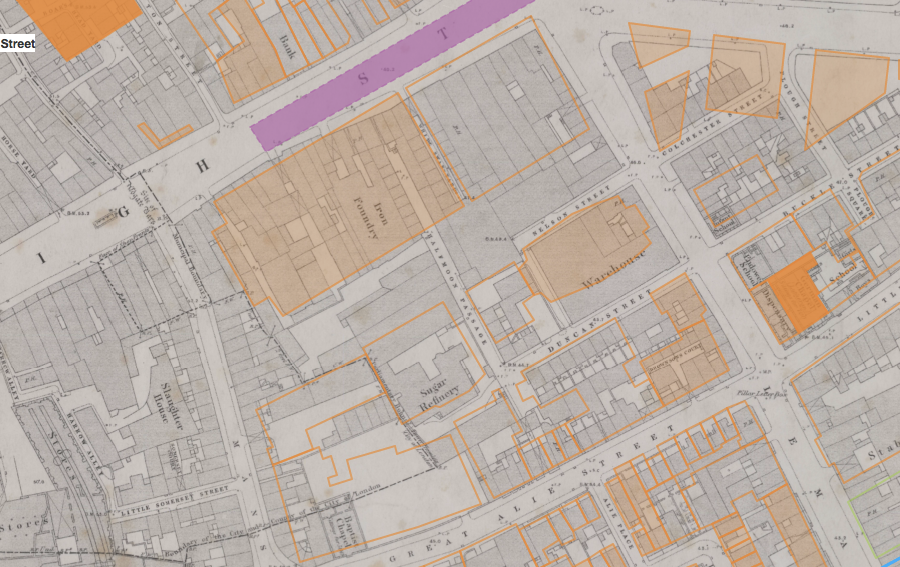
The 1873 Ordnance Survey map was provided by Tower Hamlets Local History Library and Archives, who are in possession of a complete set of this edition for the borough. Unlike the Rocque, we had to scan and georeference this ourselves. The map sheets (each around 1000x800mm) were scanned using a sheet-feed map scanner by Nick Mann at UCL, and then retouched in Photoshop. From here they were imported into QGIS (http://www.qgis.org/en/site/) and georeferenced, which involves matching up points on the scan with the contemporary street network. We used our building footprints (see https://surveyoflondon.org/blog/2016/how-we-made-map/) as our reference.
For some areas this was easier than in others: along Whitechapel Road, many of the original shop frontages are still in place, and pubs (easily identified by the 'P.H.' on the OS map), even if no longer being used for their original purpose, are in many cases still there. However, other areas (for example around Aldgate), have seen huge changes since the 1880s, and it’s trickier to align the old map with the new.
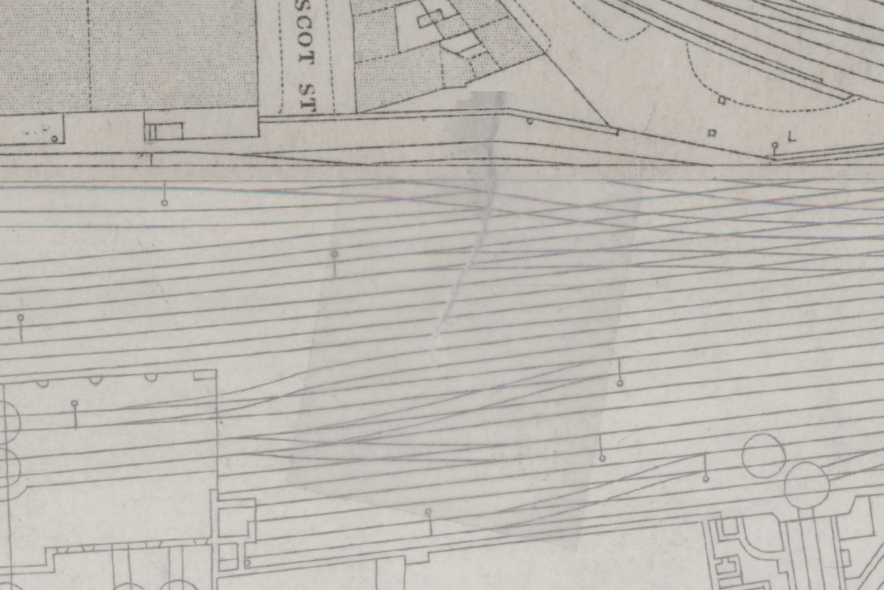
One of the nicest things about our 1873 OS layer is that the particular copies Tower Hamlets Local History Library and Archives lent us have obviously been heavily used. Some of the sheets are in quite poor condition: the south-western area of the study area (around the Royal Mint Estate, towards the Tower of London) in particular is quite tatty, and in places you can see where it’s been torn and taped to hold it together:
In other places it’s been annotated, for example on this area by Wellclose Square:
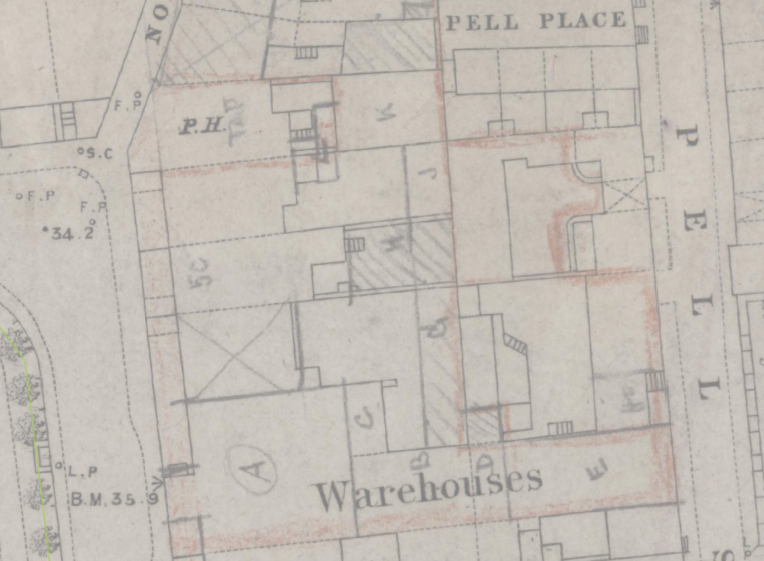
The buildings these marks refer to are gone, and we don’t know what the annotations mean, but it’s a nice illustration of the way that the historic maps aren’t just useful in that we can use them to see what’s changed between then and now, but are tangible documents whose condition testifies to their history of ownership and use.