How we made the Map
Posted by Duncan Hay on Sept. 1, 2016
When the project was conceived, the Survey of London had hoped to use Ordnance Survey MasterMap as the source of our building outlines, as this is the basis of all of the maps in the Survey of London volumes. However, the terms of the OS licence prevents you from using MasterMap data online in this way, so we had to look at other options.
Our first option was to use OpenStreetMap, but these weren’t detailed enough for our purposes, and there were mismatch issues when working with historic maps because of the different map projections used by OpenStreetMap and by British cartographers. We therefore looked at two Open Government Licensed maps as the source for our buildings: the Ordnance Survey OpenMap Local, which contains block-level building outlines, and the Land Registry’s vector map of the UK’s land ownership units.
Because Whitechapel is a relatively small area we decided to manually split the OpenMap Local building footprints using the Land Registry polygons as a guide. However, Adam Dennett at CASA developed a method for programmatically splitting the OpenMap local polygons, meaning that this method for producing building footprint polygons could potentially be scalable to the whole of the UK. However, we soon ran into another problem: despite the Land Registry polygons being published under an Open Government Licence, because they are ultimately derived from MasterMap, we were advised that building footprints created in this way couldn’t be published online either, which left us back at square one.
Our final option was to draw our buildings from scratch. Happily, there was another open data set which we could use as a basis: the LIDAR imagery released by the Environment Agency. LIDAR is a scanning technique which involves firing a laser from an aircraft at the ground and measuring the time that it takes for the light to bounce back. The results can be used to build up detailed pictures of landscapes and the built environment, which look like this:
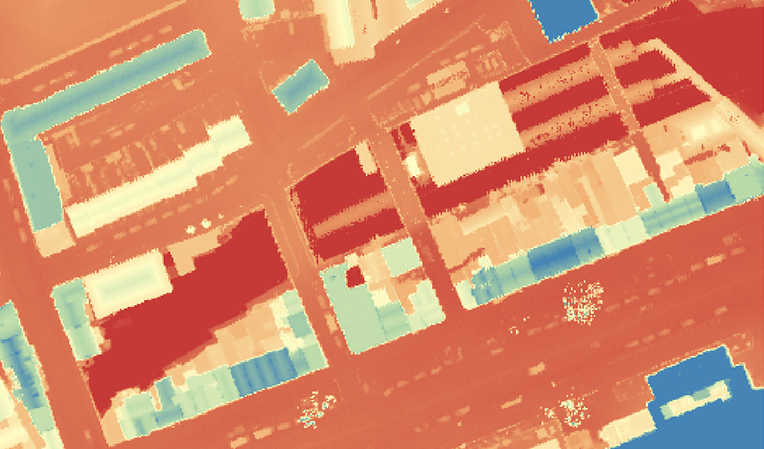
LIDAR imagery, © Environment Agency copyright / and or database right 2015
This image shows a section of Whitechapel Road. Whitechapel Station is the large pale orange rectangle towards the top, with the tube line (at this point open to the air) visible as the dark red swathe across the whole image. The light blue shapes are the shopfronts on Whitechapel Road, the dark blue shape at the bottom the former Royal London Hospital building. You can just about make out some of the market stalls, and trees tend to show up as clusters of blue dots.
Whilst for larger buildings it was fairly easy to trace the outlines, it got quite complex around the backs of older buildings, particularly on Whitechapel Road. Moreover, Whitechapel is changing very rapidly, and the LIDAR imagery itself in many places doesn’t reflect what’s on the ground at the moment. However, it was good enough for our purposes to make a first pass. We then spent several days walking around Whitechapel with print-outs verifying what we’d done, and the interactive building outlines on the map are the result.


